
Scruffy - Beautiful Graphs for Ruby
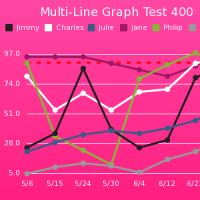
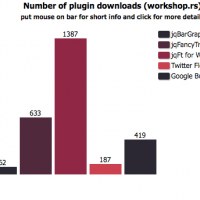
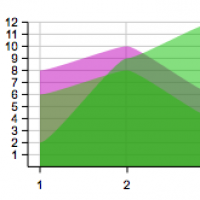
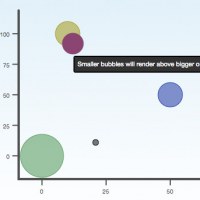
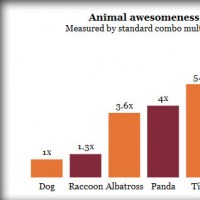
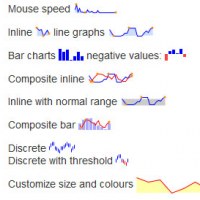
Scruffy is a Ruby library for generating attractive and powerful graphs, useful for web applications, print media and many others. It’s highly customizable and powerful. You can change the backgrounds, mix different types of graph together, change the graphics used for the points, change the line types, etc. You can also render to different types [...]