By mupet on December 24, 2009
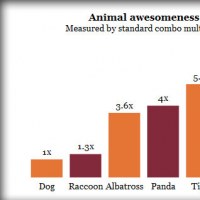
TufteGraph is a jQuery plugin that allow us to create standard & bar charts. It is different from other javascript charting libraries because, TufteGraph is configurable and it has dynamic functions, allowing for a really compact API (very few options and non-core layout is done via CSS rather than code.
Posted in Charts/Graph, JQuery | Tagged chart, graph, JQuery
By mupet on December 16, 2009
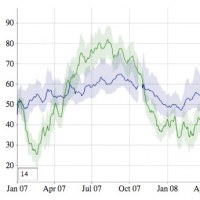
Dygraphs is an open source JavaScript library that produces produces interactive, zoomable charts of time series. It is designed to display dense data sets and enable users to explore and interpret them. You can mouse over to highlight individual values. Click and drag to zoom. Double-click to zoom back out.
Posted in Charts/Graph, Javascript | Tagged chart, Charts/Graph, graph


Recent comments