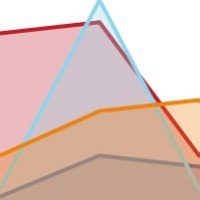
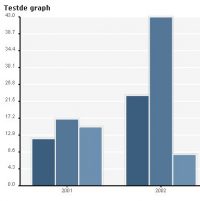
TABLETOCHART, draw a graphic chart based on the table data

TableToChart is a MooTools script that can take a HTML table source and automatically draw a graphic chart based on the table data. Incoming search terms for the article: graphic chart tabletochart graphic charts graphical chart Graphical Charts mootools tabletochart graphic table chart graphic table to chart mootools how to draw a data table

Continue Reading →

Visualize, Create Charts & Graphs from Table Elements using HTML 5 Canvas

Filamentgroup wrote a great article describing a technique how to use JavaScript to scrape data from an HTML table and generate charts using the HTML 5 Canvas element. Incoming search terms for the article: html5 graph visualization html5 datatable html5 table generator graph visualization html5 html5 graph generator using html5 to make charts jquery graph [...]

Continue Reading →

Page 3 of 3«123