RGraph -HTML5 canvas graph library
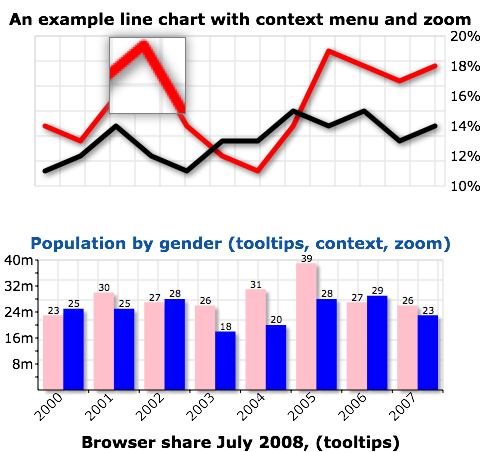
RGraph is a HTML5 canvas graph library. It uses features that became available in HTML5 (specifically, the CANVAS tag) to produce a wide variety of graph types: bar chart, bi-polar chart (also known as an age frequency chart), donut chart, funnel chart, gantt chart, horizontal bar chart, LED display, line graph, meter, odometer, pie chart, progress bar, pseudo radar chart, scatter graph and traditional radar chart.

This library uses HTML5 features which are implemented in recent browsers. As such you will need to be using one of these latest browsers: Firefox 3.5+, Chrome 2+, Safari 4+, Opera 10.5+ or Internet Explorer 8.
Older versions of Opera and other older browsers are supported in a limited fashion. If they don’t support text or shadows these will naturally be unavailable.By now, only beta version available for download.
Requirements: Firefox 3.5+, Chrome 2+, Safari 4+, Opera 10.5+ or Internet Explorer 8
Demo: http://www.rgraph.net
License: Free for non commercial use


